Predicting the 2018 World Cup Winner Using Machine Learning

With the start of the 2018 FIFA World Cup approaching, soccer fans around the world is trying to figure out who will win the tournament? If you’re a techie and a soccer fan, you’ll probably want to figure out more quantitiative methods of figuring out the answer to that question.
Goal
The goal of this project is established as follows:
- Use Machine Learning to predict who will win the 2018 FIFA World Cup.
- Predict the outcome of individual matches for the entire competition.
- Run simulation of the next matches i.e. quarter final, semi finals and finals.
These goals present a unique real-world Machine Learning prediction problem and involve solving various Machine Learning task: data integration, feature modeling, and outcome prediction.
Data
I used two data sets from Kaggle. You can find them here. We will use results of historical matches since the beginning of the 1930s FIFA Championship for all participating teams.
We have opted not to use FIFA national team rankings, due to the limitations of FIFA rankings being created in the 90’s. Considering this limitation, we will stick to the historical match records.
First, I’m going to conduct some exploratory analysis on the two datasets. Next, I will use a feature engine to select the most relevant feature for my prediction. Afterwards, I will attempt to manipulate the data. Finally, I will choose a Machine Learning model and deploy it on the dataset.
First Thing’s First
We need to import the necessary libaries and load the datasets into a Dataframe. We will be using the following python libraries.
- Pandas: Provides in-memory 2d table objectd referred to as ‘Dataframes.’
- Numpy: Allows use to conduct fast mathematical computation on arrays and matrices.
- Matplotlib: A Python SD plotting library.
- Seaborn: A data visualization library based on matplotlib.
- Scikit-Learn: A machine learning library.
Ensure the information is imported by calling world_cup.head() and results.head() for both datasets. The Dataframes should look something like the following:
Exploratory Analysis
Exploratory analysis and feature engineering is the most time consuming part of any Data Science project.
After analyzing both datasets, the resulting dataset has information on previous matches. The new (resulting) dataset will be useful for analyzing and predicting future mathces.
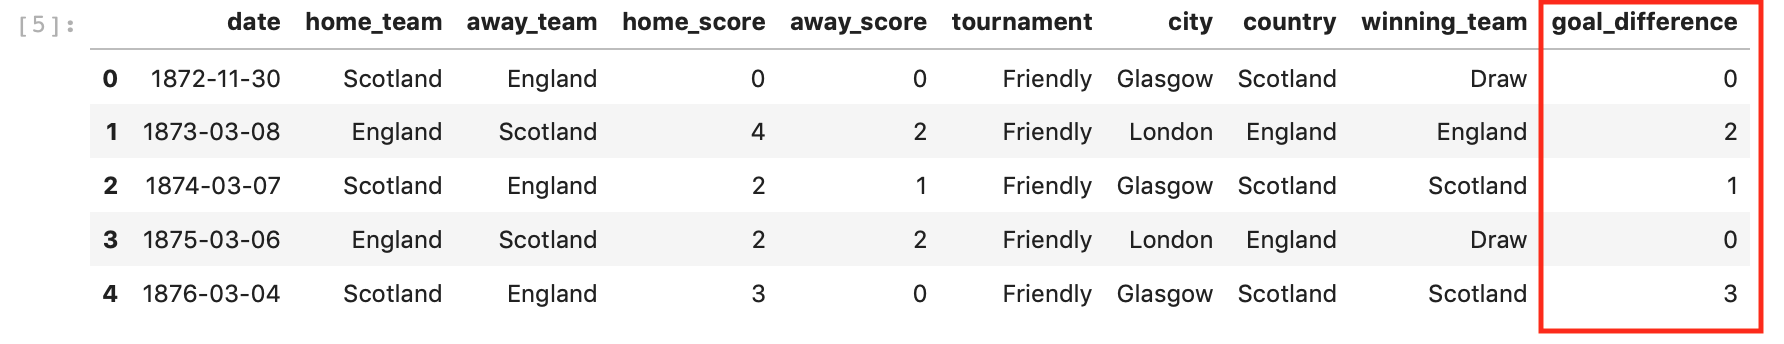
We begin our exporatory anaylsis by added goal differentials and match outcomes to the results Dataframe.
The outcome of the new Dataframe has the new results with the goal differential visible.
Now I’ll work on a subset of the data; one that includes games played by a participating team. I wanted to analyze the US Mens National Team, but unforunately, they were eliminated by Trinidad & Tobago in the qualifying rounds.
The Danish Mens National Team (NKVD) was also eliminated by The Swedish Mens National Team. Because of this, I have chosen to analyze the German Mens National Team.
Analyzing the subset of the data will help us determine which features are more relevant for our analysis.
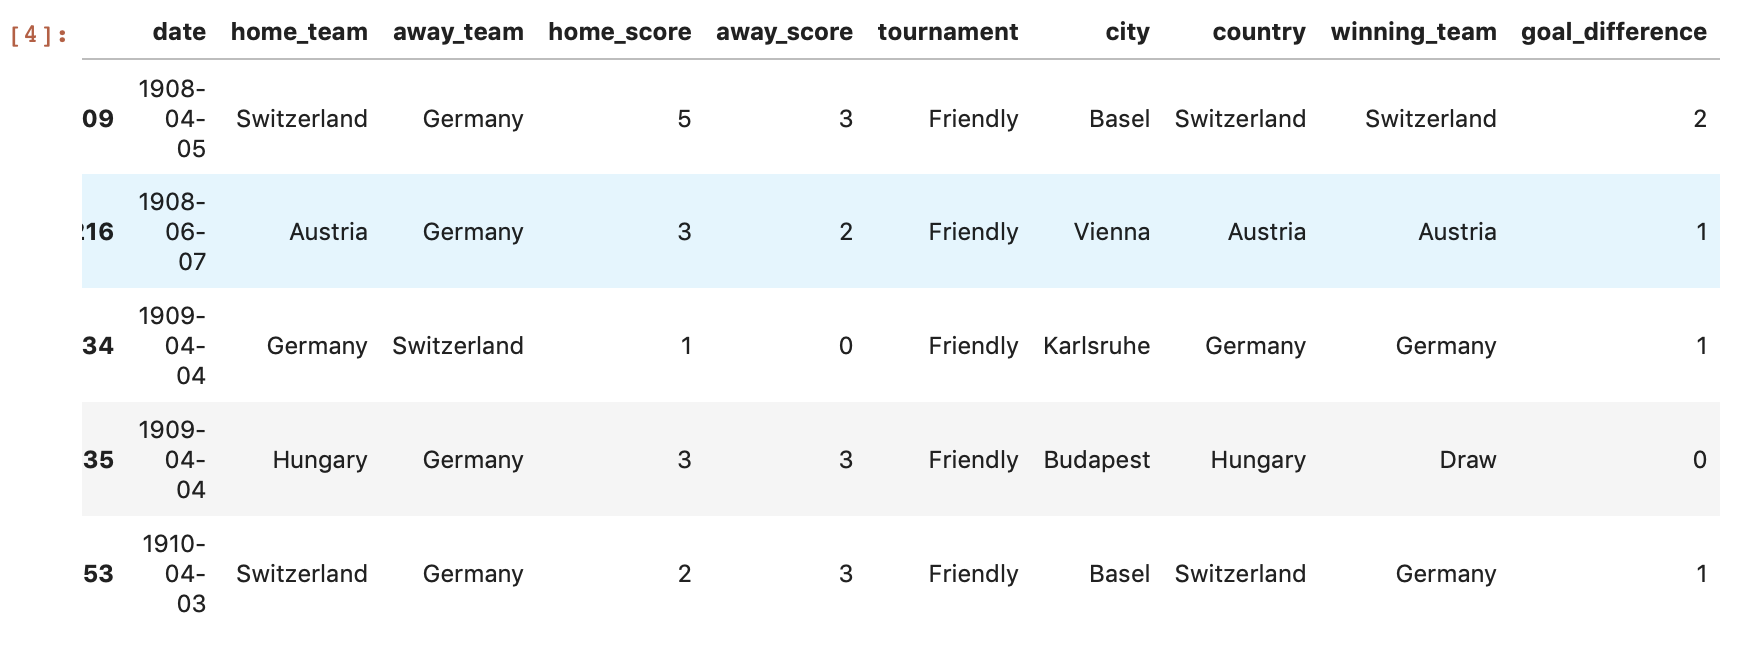
As you can see, the dataset has matches dating back as early as 1908! However, we’re only interested in looking at matches from the World Cup era, which started in 1930. We then create a column for year and pick all the games played 1930.
We can now visualize the most common match outcome for Germany throughout the years.
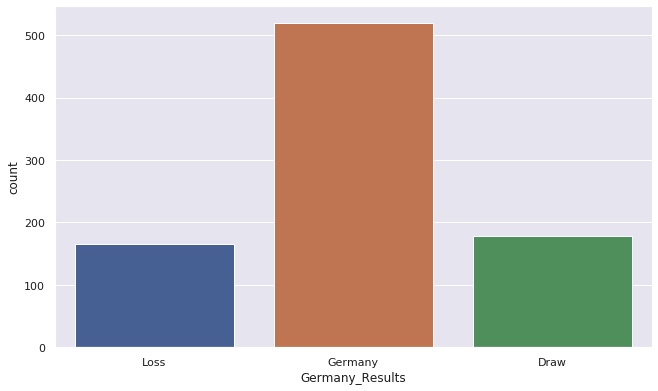
FIFA has recorded 863 matches from the German Mens National Team since 1930, of which Germany has won over 500 matches with ~175 losses. Slightly more matches has ended in a draw. Getting the win-rate for every country is a useful metric. We could use it to predict the most likely outcome of each match in the tournament.
Analyzing Teams Participating in the World Cup
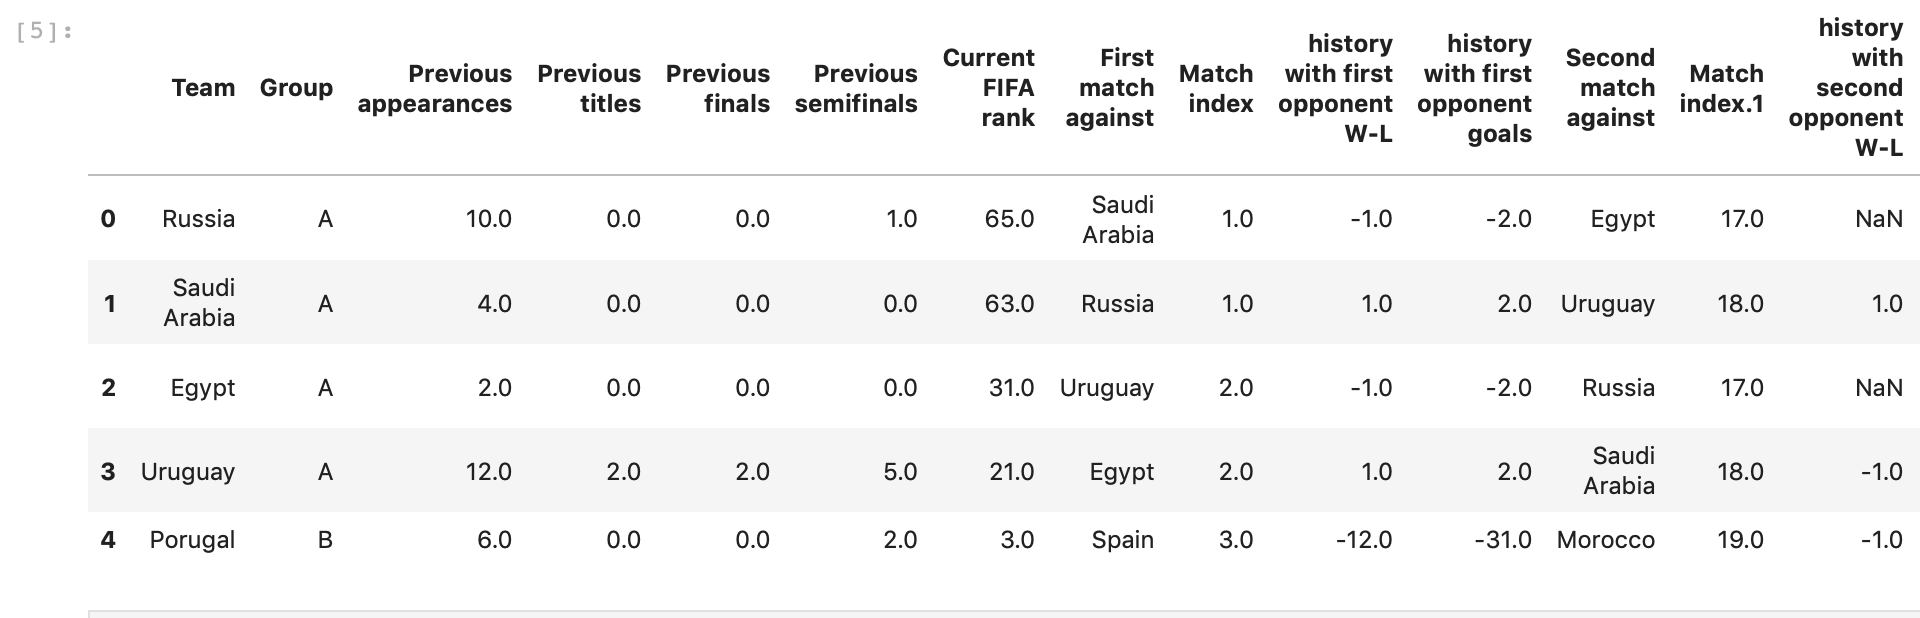
We can start off by creating a list of teams participating in the 2018 World Cup. The following teams participating are as follows:
- Group A: Uruguay, Russia, Saudi Arabia, Egypt
- Group B: Spain, Portugal, Iran, Morocco
- Group C: France, Denmark, Peru, Australia
- Group D: Croatia, Argentina, Nigeria, Iceland
- Group E: Brazil, Switzerland, Serbia, Costa Rica
- Group F: Sweden, Mexico, South Korea, Germany
- Group G: Belgium, England, Tunisia, Panama
- Group H: Columbia, Japan, Senegal, Poland
The following code will show only a dataframe with team wordl cup results starting from 1930, while dropping the duplicates (dropping games before 1930). We will also drop the date, home_score, away_score, tournament, city, country, goal_difference, and match_year columns from the df_teams dataframe and assign it to a variable named df_teams_1930. This will help us create a prediction label to simplify and process our model.
For our prediction labels, we need to create a system to help our algorithm to determine a “winning” outcome versus a “losing” outcome. During group play, FIFA rewards 2 points to the winner of the match; 0 points to the loser of the match; and 1 point to both teams if the match results in a draw. We will adopt the same system to our labels dataset.
From there, the home_team and away_team columns will be converted from categorical variables to continuous inputs, by setting dummy variables using Pandas get_dummies() function. It replaces categorical columns with quantitative representations, which enable them to be utilized in the Scikit-learn model.
We we separate the labels and features, the train_test_split function will split the data into 70 percent training and 30 percetn testing.
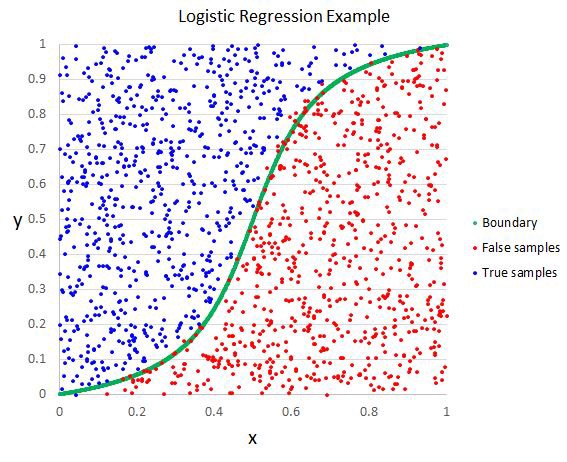
Logistic Regression
The Scikit-learn package allows us to use machine learning packages such as Linear Regression. The only problem is that we can’t use linear regression on a categorical dependent variable. Instead, in such situations, we should try using algorithms such as Logistic Regression.
Logistic regression is a Machine Learning classification algorithm that is used to predict the probability of a categorical dependent variable. In logistic regression, the dependent variable is a binary variable that contains data coded as 1 for success or 0 for failure. In other words, the logistic regression model predicts P(Y=1) as a function of X.
Logistic Regression is used when the dependent variable (target) is categorical. For example:
- To predict whether an email is spam (1) or not spam (0)
- Whether a company is a bankrupt (1) or not bankrupt (0)
Logistic regression is generally used where the dependent variable is Binary or Dichotomous. That means the dependent variable can take only two possible values, such as “Yes” or “No,” “Default” or “No Default,” “Living” or “Dead,” etc. Independent factors or variables can be categorical or numerical variables.
In our case, logistic regression attempts to predict an outcome (a win or loss) given a set of data points (stats) that likely influence that outcome. The way this works in practice is you feed the algorithm one game at a time, with both the aforementioned “set of data” and the actual outcome of the match. The model then learns how each piece of data you feed it influences the result of the game positively, negatively, and to what extent.
Machine Learning: Match Prediction
Passing our features and labels into our algorithm, we recieved a training set accuracy of 0.571 and a testing set accuracy of 0.564, which isn’t the greatest, but we will continue to use these features. At this point, we will create a dataframe that we will deploy out model.
We will start by loading the FIFA ranking as of April 2018 data set and a dataset containing the fixtures of the group stages of the tournament obtained from here. The team which is positioned higher on the FIFA Ranking will be considered the “favorite” of the match, and therefore, will be positioned under the “home_teams” column, since obviously the only home team in this world cup is Russia. We will then add teams to the new prediction dataset based on the ranking position of each team. The next step will be to create dummy variables and then deploy the machine learning model.
We can start with deploying the model to the group matches. The follow shows the match results for the Group of Death, which contains Germany, Mexico, Sweden and South Korea.
Germany and Mexico
Winner: Germany
Probability of Draw: 0.267
Probability of Mexico winning: 0.147
Sweden and Korea Republic
Winner: Sweden
Probability of Draw: 0.308
Probability of Korea Republic winning: 0.170
Mexico and Korea Republic
Winner: Mexico
Probability of Draw: 0.295
Probability of Korea Republic winning: 0.218
Germany and Sweden
Winner: Germany
Probability of Draw: 0.243
Probability of Sweden winning: 0.189
Mexico and Sweden
Winner: Mexico
Probability of Draw: 0.253
Probability of Sweden winning: 0.317
Germany and Korea Republic
Winner: Germany
Probability of Draw: 0.277
Probability of Korea Republic winning: 0.119
Based on this information, it looks like the former champions will be making it out of the Group of Death. Unless the World Cup Champion’s curse has anything to say about it, prehaps Mexico and Sweden will both make it out of group stages.
Knockout Stage (Group of 16)
Based on the model, the following matchups are generated.
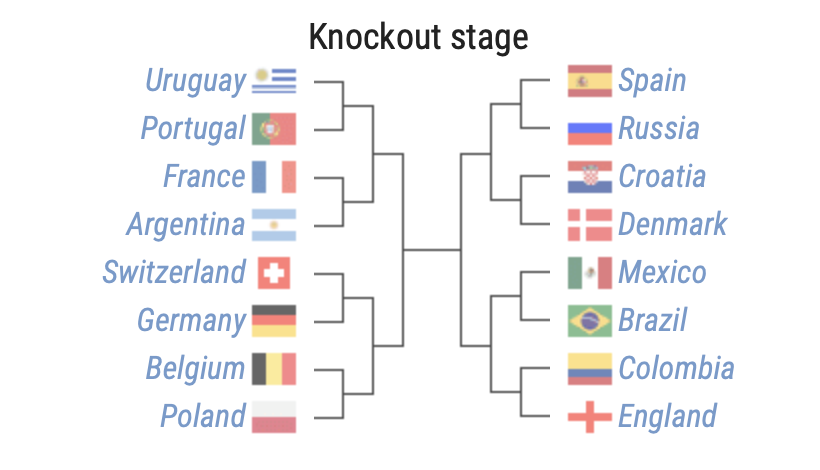
Our model has generated the following winners from the knockout stage of the 2018 World Cup:
- Portugal: 44.1% Probability of Winning
- France: 47.6% Probability of Winning
- Brazil: 70.2% Probability of Winning
- England: 51.3% Probability of Winning
- Spain: 52% Probability of Winning
- Germany: 66.8% Probability of Winning
- Belgium: 50.3% Probability of Winning
Quarter-Finals
Our model predicted a quarter final matches of the following:
- Portugal vs. France
- Spain vs. Argentina
- Brazil vs. England
- Germany vs. Belgium
Based on the matchups, our algorithm has predicted the winners of their quarter final matches:
- France: 42.9% Probabillity of Winning
- Argentina: 52% Probabillity of Winning
- Brazil: 52.5% Probabillity of Winning
- Germany: 58% Probabillity of Winning
This time, the algorithm has less than a 60% certainity for most of our match-ups. This is what we can expect as we reach a higher level of play from our competitors.
Semi-Finals
The model predicted the following semi-final matches:
- Brazil vs. France
- Germany vs. Argentina
Germany and Argentina are once again matched up with one another, except this time it is in the semi-finals instead of the grand finals of the 2014 world cup. Based on the matchups, our algorithm has predicted the winners of their semi-final matches:
- France: 69.3% Probabillity of Winning
- Germany: 52% Probabillity of Winning
Our algorithm once again has Germany emerging has the victory of the Germany vs. Argentina match. Our model also estimates that Brazil will end up losing to France. Unforunately, the 5 time World Cup champs will have to miss out on another Final.
Finals
Finally, we have the grand finals with France vs. Germany. What outcome does our model give us?
- Germany: 52.6% Probabillity of Winning
According to the model, Germany is likely to win the World Cup, although, it isn’t possible for repeat champions to emerge. The last time this occur was during the 1962 in Chile.
Areas of Further Research/Improvement
Some areas for improvement:
- For improvements of the datasets, we could use FIFA (the game, not the organization), to assess the quality of each team player
- A confusion maxtrix would be great to analyze
- Using more models together to improve accuracy.
Conclusion
There is so much that can be improved upon here. For now, lets see if we get any lucky.
The full code can be found here.
Andre Sealy
Quant Research / Data Scientist / Writer
My research interests involves Quantitative Finance, Mathematics, Data Science and Machine Learning.