How To Lie With Inflation Statistics
Inflation is probably one of the most difficult phenomena to understand. It’s such a difficult topic to understand, most people have difficulty defining it. At the very least, it can be defined as a broad increase in the average level of prices throughout the entire economy. Some people also define inflation as simply an increase in the money supply. Even more difficult than simply defining the term, most probably aren’t aware of how inflation actually occurs, which can originate through a number of different factors. I’m not going to go through them all, but economists can probably agree that inflation is not an observable phenomenon.
I’m not going to go through them all, but economists can probably agree that inflation is not an observable phenomenon. Well, the only exception might be if the economy was experiencing what we would refer to as ‘hyperinflation‘. In that case, inflation would be similar to pornography, you’ll know it when you see it.
However, since individuals can’t really observe inflation, the best that we can do is try to measure it. There are many different ways to measure inflation, which means there are many different ways to measure things in real terms. This makes measuring information such as ‘real wages’ more of an art rather than a science.
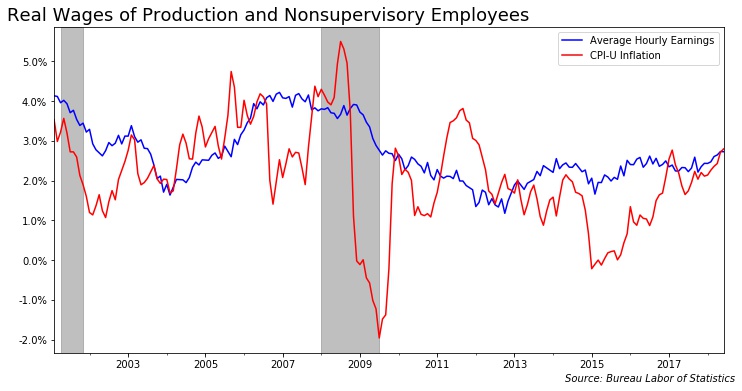
You would probably enter “real wages are falling” into a Google search bar and find many different articles relating to wages falling in real terms. For example, this article from the Washington Post outlines how inflation has eroded the purchasing power of their wages [1].
Without adjusting for inflation, these “nonsupervisory” workers saw their average hourly earnings jump 2.8 percent from last year. But that was not enough to keep pace with the 2.9 percent increase in inflation, which economists attributed to rising gas prices.
“This is very likely because of the spike in oil prices eating into inflation-adjusted earnings,” said Allen Sinai, chief global economist and strategist at Decision Economics. “We pay for energy-related costs out of our wages, out of our compensation. And it’s making a real impact.”
Based on the way the authors of this article is measuring inflation, it would appear that wages are barely keeping up with inflation.
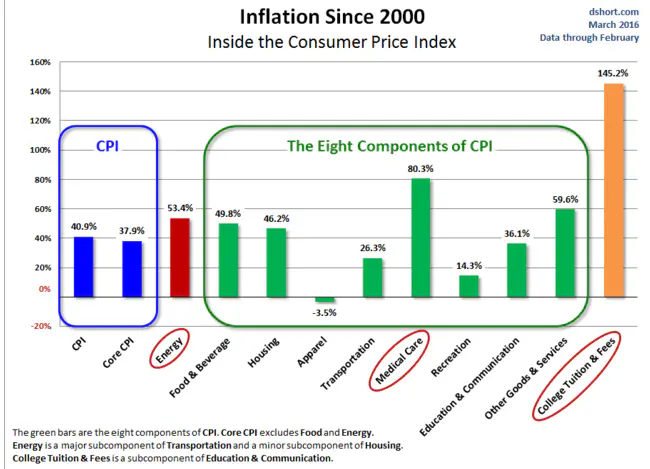
There is just one thing wrong with only looking at headline inflation; the authors of the article already pointed out one of the flaws. Inflation appears to be increasing due to rising energy prices. Considering this, we should look at an inflation metric that removes the effects of rapidly increasing energy prices, such as core-CPI.
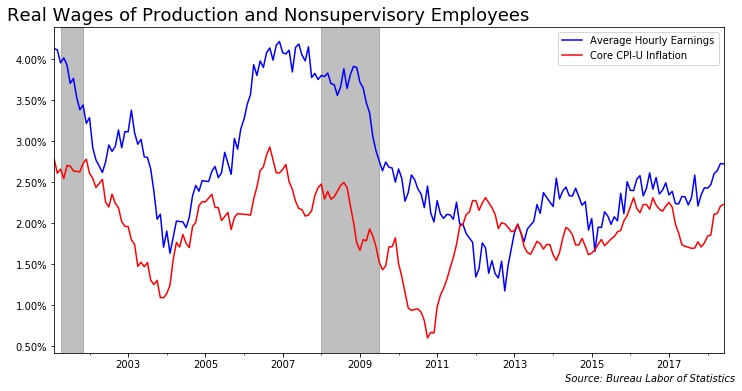
Using this inflation metric, we can see that real wages aren’t falling. So why does it matter whether or not someone is going core-CPI or headline CPI? Core CPI is merely the same as headline CPI, which excludes the price changes in food and energy. This is because food and energy tend to be very volatile, which may unfairly distort how inflation is measured.
The this imply that the writers of the Washington Post article, Jeff Stein and Andrew Van Dam, are lying about inflation? It doesn’t imply that they were intentionally trying to mislead. After all, using headline CPI, it is true that inflation is outpacing wage growth. However, it is possible for someone to use inflation statistics for the purposes of being misleading.
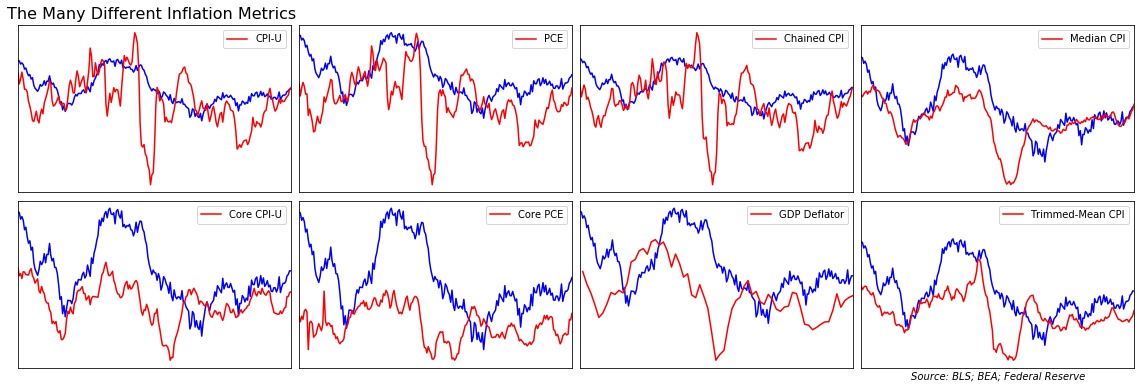
The following image shows Annualized Average Hourly Earnings compared with 8 different inflation indicies: Headline and Core CPI, Headline and Core PCE, and the GDP Deflator. I’ve also included 3 alternative measures of the CPI: the Chained, Trimmed-mean and the Median CPI.
As you can see, some of these metrics (PCE, GDP Deflator, and the Trimmed-Mean CPI) actually show that real wages are rising, not falling. So which inflation metrics should we be using? That all depends on what people are measuring.
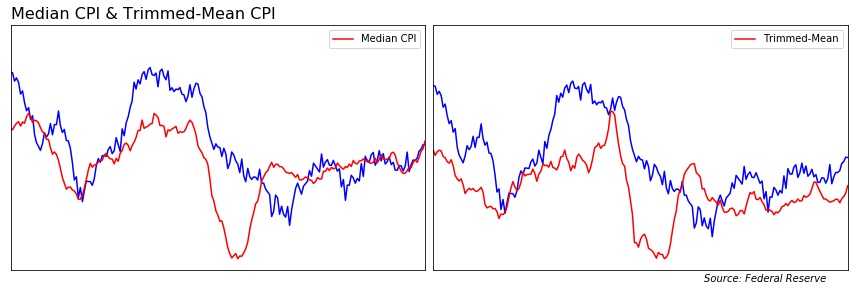
Median and Trimmed-Mean CPI
As mentioned before, Core CPI (as well as PCE) throws out the most volatile price changes: food and energy. Some people may not prefer to do that, as food and energy are good and people actually purchase on a daily basis. Instead, one could use a more mathematically sophisticated price index like the median and Trimmed-Mean CPI. They achieve the same goal; however, instead of throwing out food and energy, the median and Trimmed-Mean CPI removes the items with the largest price fluctuations within a given month.
You could think of it as removing the outliers from a particular dataset. Instead of calculating the weighted-average basket of goods, the median CPI price changes of all goods and services. The Trimmed-Mean CPI works in a similar fashion, by removing 8% of items with the highest and lowest one-month price change, resulting in a 16% Trimmed-Mean Inflation Estimate. When looking at both of these inflation metrics, in terms of the Median CPI, wages currently in-line with inflation. In terms of Trimmed-Mean, wages are outpacing inflation.
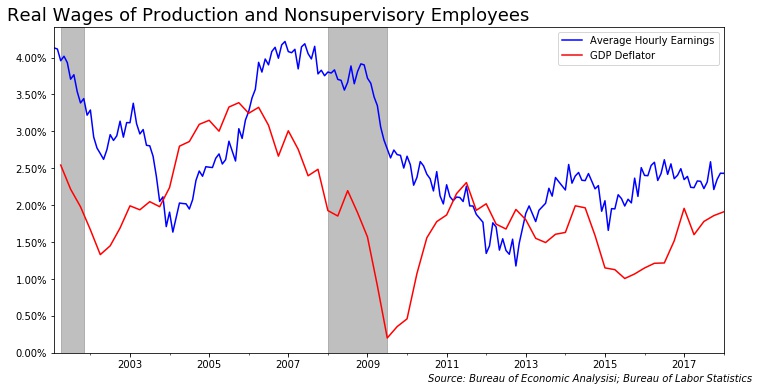
GDP Deflator
The GDP Deflator is another lesser-known inflation metric, but still just as valid. While most inflation metrics only measure price changes of goods and services, the GDP Deflator measures the price of everything in the economy, such as investment spending in the economy.
For example, businesses purchase a lot of computer equipment and computer equipment is measured as a part of GDP. As such, one could expect the prices of computer equipment to be passed on to consumers. However, the price of electronics has actually fallen over time (if you consider the amount it takes to purchase at the average industrial wage), overall price fluctuations in the GDP Deflator will tend to be smaller as a result.
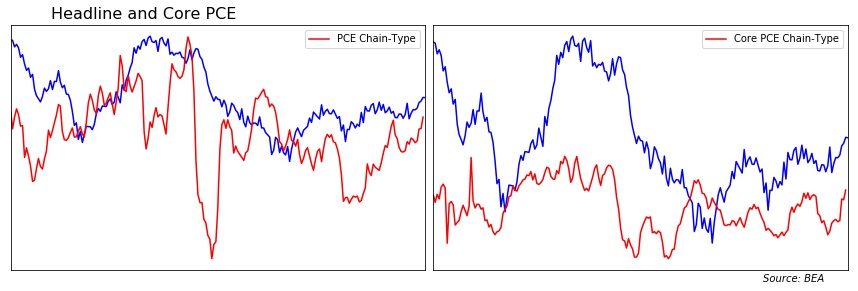
PCE Chain-Type Index
Last, but not least, we have the Personal Consumer Expenditure Change-Type Index (or PCE). The PCE is similar in some ways to the CPI; however, whereas the CPI measures a basket of goods and services based on out-of-pocket purchases, the PCE the same basket based on purchases by consumers and on behalf of consumers.
For example, consumers may utilize an employer-based health insurance plan. This employer would purchase a policy on behalf of its employer. Or the government could purchase an insurance policy on a public/private insurance exchange on behalf of a taxpayer. This, as a result, allows statisticians to better monitor the shopping habits of consumers more closely.
In fact, the PCE Chain-Type Index is the preferred metric of the Federal Reserve for this particular reason. Sure, it does look at other measures of inflation to gauge inflationary pressures in the economy. However, the FOMC is going to place a greater weight on PCE inflation when making it’s policy decisions.
When we look at both headline and core PCE, we find that real wages are also rising.
So, is there anything wrong with using CPI over PCE? Which inflation metric should people be using? Like everything, it always depends and it usually helps to understand how both indices weight certain goods and services.
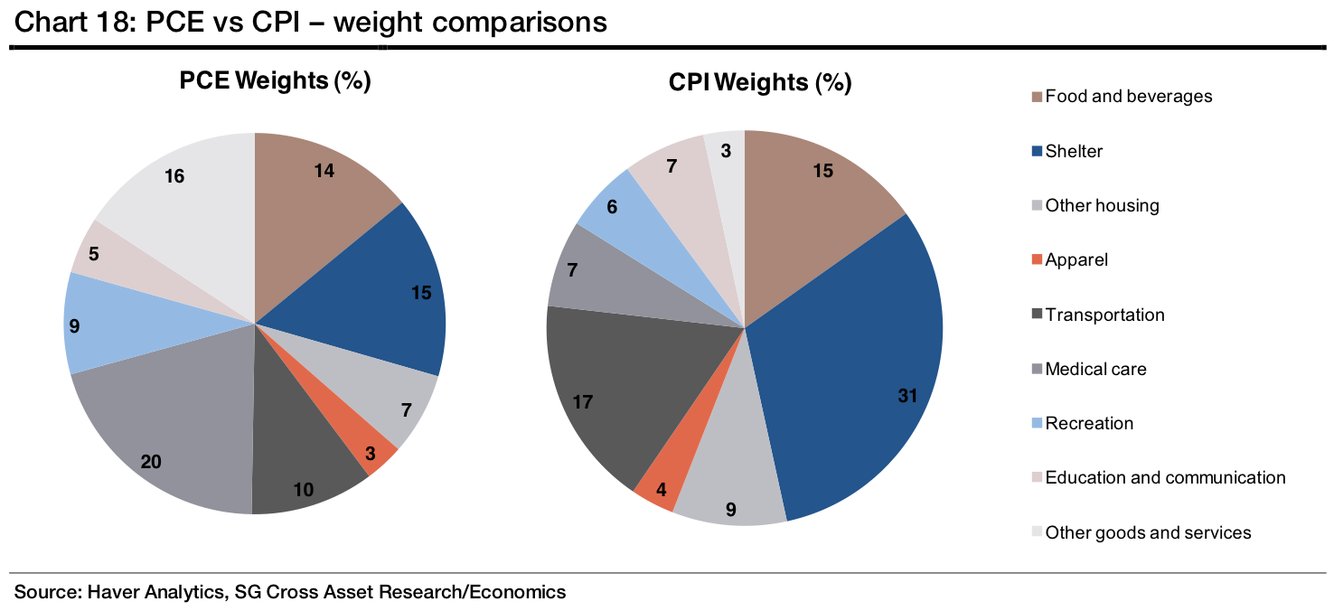
I’m not actually sure about how the Bureau of Labor Statistics determines how it weighs certain items in the Consumer Price Index. However, I know that Personal Consumption Expenditure Chain-Type Index is weighed in terms of the portion someone spends on a good or services relative to overall expenditures.
For example, according to NIPA data from the Bureau of Economic Analysis, consumers spend roughly 20% of their income on medical care services, which is reflected in the PCE weighing. However, medical care only covers a 7% weighing in the CPI, so the price changes in the CPI will fail to reflect rising medical cost.
Also, for whatever reason, shelter has a 31% weight in the CPI, but only a 15% weight in the PCE index. According to NIPA data, consumers spend roughly 17% of their income on shelter, which is in line with PCE weights.
Considering the PCE does a good job of tracking the goods and services purchased by consumers, if I’m interested in tracking inflationary pressures, I would want to place greater emphasis on the PCE.
Conclusion
There really isn’t much of a debate centered around this topic; most of the inflation metrics listed here are legitimate and are used for different purposes. Although measuring inflation is more of an art rather than a science, selecting an inflation metric should be backed by a scientific analysis.
In other words, if people are going to select the PCE over the CPI (and vice versa), there needs to be a reason why. As long as there is some subjectivity with these matters, I believe this approach is a step in the right direction.
After all, numbers don’t lie; however, the people who provide the numbers sure can.
Andre Sealy
Quant Research / Data Scientist / Writer
My research interests involves Quantitative Finance, Mathematics, Data Science and Machine Learning.