Chart of the Day: 3-Month Bill Bid-To-Cover Ratio Plunges
While demand for US Treasuries remains brisk at primary auctions, the same can hardly be said for the short-end of the market, where moments ago we saw what happens to auction demand in a time of rapidly rising rates.
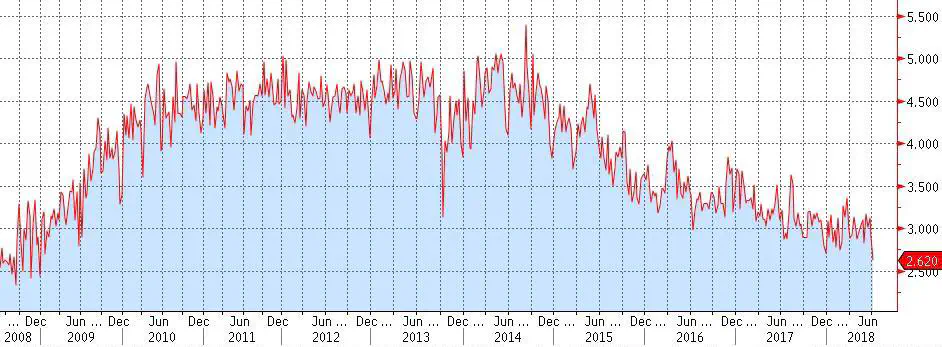
As shown in the chart above, while the yield on the 3 month Bills auctioned off today came in largely as expected at 1.94%, the demand did not, and after an already depressed Bid-to-Cover ratio of 2.89 last week, today’s 3-month auction suffered from one of the lowest demands on record, tumbling to just 2.62. At $125.88 billion in bids tendered for $48 billion in paper, down sharply from $138.87 billion on June 25. In context, the last time the markets have witnessed a Bid-To-Cover ratio this low was post-Lehman crisis.
With both T-Bill issuance continuing to surge, and ratings rising, two things are certain: not only will the Libor-OIS spread resume blowing out amid the continued surge in short-term supply and increasingly tighter financial conditions, but demand will continue to slide. However, the good news is that we are still well off from the record lows, in which auctions were only 2.0x covered at the start of the century. That said, who knows: perhaps the break in the bond market will begin with a failed Bill action as the US Treasury finds it increasingly difficult to roll over short-term debt.
Andre Sealy
Quant Research / Data Scientist / Writer
My research interests involves Quantitative Finance, Mathematics, Data Science and Machine Learning.